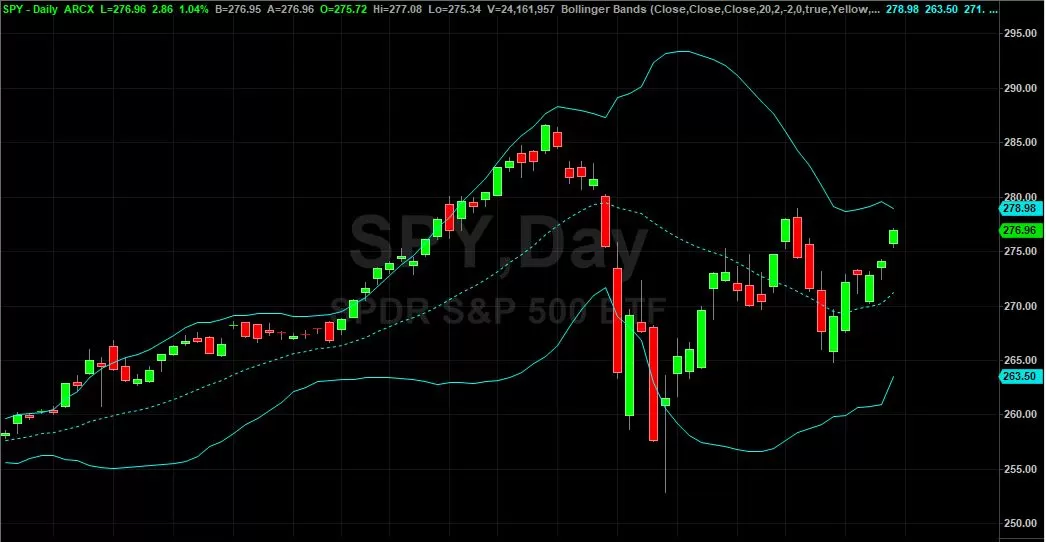
Bollinger bands are one of the most popular and widely used technical indicators. Many successful trading strategies are based on nothing more than Bollinger bands and a few complementary indicators.
The key to the success of the Bollinger bands indicator is its simple and universally applicable representation of a security’s recent historical price movement and general volatility. This simple and intuitive representation offers ample ground for the development of highly effective trading strategies based on the recent price action within the historical boundaries that the Bollinger bands represent.
Bollinger Bands
Bollinger bands are based on a simple moving average of a security’s price, the middle line, and the upper and lower boundaries or ‘bands’ that represent two standard deviations from this moving average.
The simple and intuitive theory behind the use of Bollinger bands is the general limitations of a security’s price change based on its recent history. The price of a security is unlikely to deviate far beyond the upper and lower boundaries set by its recent volatility, and any sharp movements in price toward these bands are likely to lead to corrections in the short term.
This general principle then offers a number of advanced and sophisticated strategies that traders can use to effectively predict short term price action.
Double Bottoms
Probably the most popular and commonly used Bollinger bands trading strategy is the double bottom. This strategy looks to identify a common pattern of lower resistance level testing that happens before a sharp price rally.
The first bottom should occur on high volume and stop below the lower band. This sets the lower resistance level that is tested again on lower volume with a second bottom, this time within the lower band or even on the actual lower band itself.
This double bottom signals that the market has found a lower support level, and will now seek out an upper bound with a subsequent sharp rally.
Candlestick Reversal
This next strategy uses a candlestick chart to act as a complementary indicator for fading reversals. Instead of merely buying and selling every time a security’s price exceeds the Bollinger bands, complementary indicators help to identify and time trades to increase their rate and magnitude of success.
The candlestick reversal involves waiting for prices that have moved outside their Bollinger bands to close at either a daily high or low before trading on an upcoming correction. Therefore, a stock whose price has exceeded its upper band will be ready for a correction downward when it ends a trading down at the lowest price for that day.
Band Squeeze
The Bollinger bands squeeze strategy relies on correctly predicting sudden price breakouts. Volatility tends to tighten alongside waning volume right before a major price breakout, and traders use this signal to position for these rapid spikes in price, volume and volatility.
The Bollinger bands squeeze strategy relies on correctly identifying a tightening of the bands and a complementary drop in volume. It is important that volatility and volume are dropping at the same time for an extended period, then the price, volume and volatility should rise slowly for a few days before the full breakout occurs.
Final Thoughts
As a trader or investor it is important to understand technical indicators and how they work. Bollinger Bands are a widely used indicator that can help you find excellent entry and exit points by using the techniques above. Make sure to practice using Bollinger Bands in a simulator until you have a solid understanding of how they work.


