I have been a part-time stock trader for about 5 years now. I have made tens of thousands of dollars swing trading small cap stocks (usually buying and holding for 1-4 days). These stocks are highly volatile, which gives me the opportunity to make 10% gains on a position in just a few days.
But with high reward there is always some risk. In this article, I want to show you the three main stock trading patterns that I trade. These are high probability patterns that have proven very profitable for me.
My Three Favorite and Simple Stock Patterns
A few years ago, I learned three patterns that occur almost daily in a stock chart somewhere in the market.
It took me many years to learn how to spot them, trade them and make money consistently with them.
These stock patterns have a higher than average probability of predictable stock price movement. This doesn’t mean that they work all the time or that you will be able to trade them effectively.
However, these patterns are well-known and not my invention. One of them is considered the most predictable stock chart pattern in the world. Read on to find out which one!
In this article, I will show you the simple chart patterns and how I trade them. I will go through each pattern and show you a real-life example of the strategy in action.
Sound good? Let’s get started!
What are The Three Patterns?
These patterns work. But they take practice and discipline – If you have never traded this style or these patterns then I recommend paper trading or using small position sizes.
Before I start going through the patterns, I want to tell you about the simple rules that I follow with all of these patterns:
- I sell the stock if I am up 10% or more. Sometimes I might hold out for 20% but usually I will sell half of my position at 10%.
- I always set a stop loss. I will always sell if the stock breaks its support and never take more than a 5% loss. This is so important!
- I never buy more if the stock price goes against me.
These are just my general rules and you should have your own set that you are comfortable with.
- The Fish Hook Oversold Chart Pattern
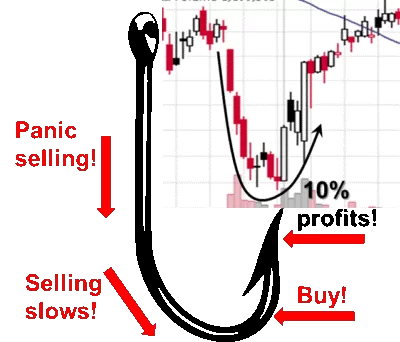
People tend to freak out if a stock price falls quickly. This pattern capitalizes on the opportunity that this presents. When the price of a stock plummets, sometimes it is just an emotional reaction and doesn’t actually reflect the value of the stock.
There is a high probability that the price of the stock will bounce back up in price once all the panic sellers have left. The pattern that forms over a few days is known as a Fish Hook pattern, because that is what it looks like!
The chart below shows an example of the Fish Hook pattern.
There is even an actual fish hook….but in all seriousness, this is one of my favorite chart patterns to trade over a few days. Each candle in the above chart represents a day of trading action.
The pattern starts when a stock plummets in price over 4 or 5 days. This has to be a rapid drop in price. Then a period of consolidation will start to form as buyers neutralize the selling pressure.
It is important not to buy the stock until the final stage has started – the price start to go back up. If you buy too early, the stock might just continue falling price. Or you might just be stuck in a stock that doesn’t have any kind of price direction.
Ideally, I purchase the stock as it starts to curve back up in price, with increasing volume and strengthening Relative Strength Index (RSI). When all these criteria are met, the chances of a nice 10% gain or so in just a few days is maximized.
How to find stocks that fit the Fish Hook Pattern
Finding stocks that are setting up for a Fish Hook pattern is not too difficult. I use Finviz to filter for stocks that have the following:
- A price of less than $10 per share. This flexible and just a rough guide.
- Oversold with RSI of 30. Ideally, RSI should be starting to increase, indicating a bounce is imminent.
These two criteria will usually bring up a list of potential stocks. The ones that look like they are forming a Fish Hook pattern are put on my stock watch list.
I always set a stop loss where I will sell my position. This is normally at the lowest point on the Fish Hook pattern. If the price falls below that, I will sell and cut my loss.
Example of a Fish Hook pattern trade
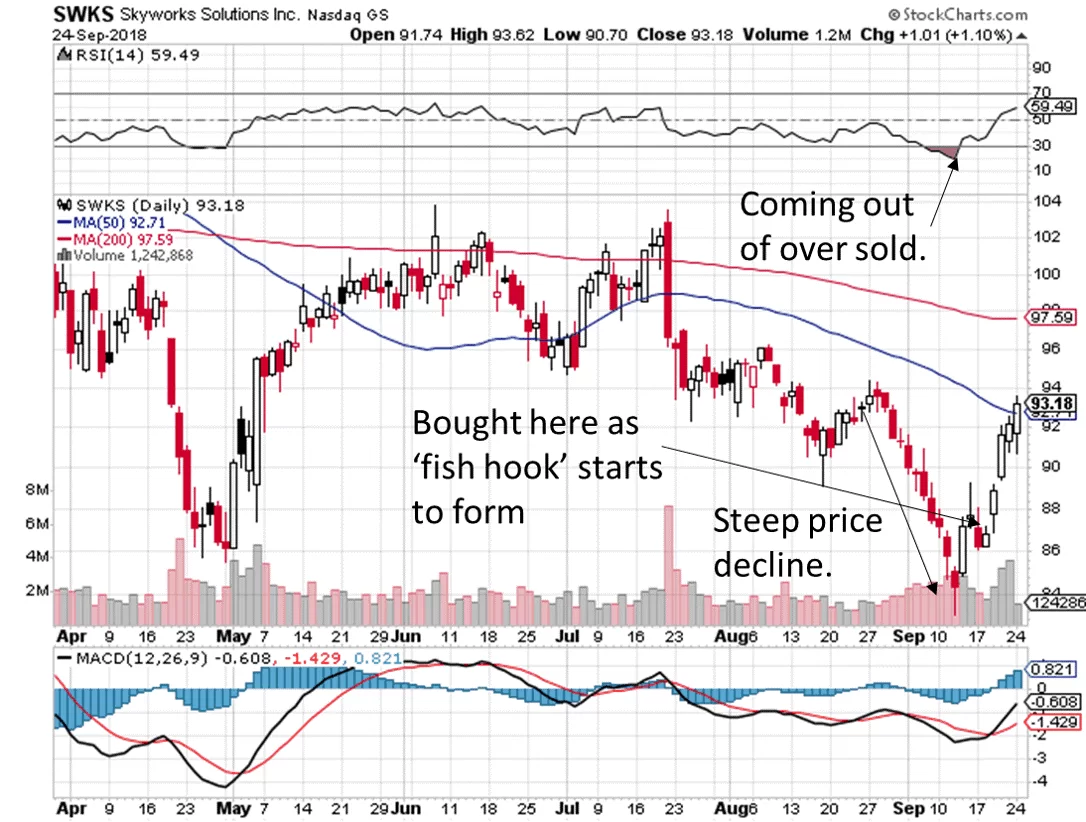
Here is a recent example of a trade I made that shows the Fish Hook pattern in action.
The chart below shows the Fish Hook pattern twice – one formed in May and one in September.
I traded the September Fish Hook pattern. I made a quick 5% profit in 3 days. Not the best trade ever, but it is a good example of the pattern!
At the end of August, the price of the stock (SWKS) fell rapidly and the drop in price into the oversold regime was flagged as a potential trade by my screener.
As the chart started to rebound and the RSI started to curl up, I purchased shares at about $87 per share (on the right of the chart). You can see from the chart that the price continued upwards over the next few days, completing the Fish Hook pattern.
Sounds pretty simple right? Well, when the pattern works it does feel easy! It is a reliable pattern, but it does fail 30% of the time.
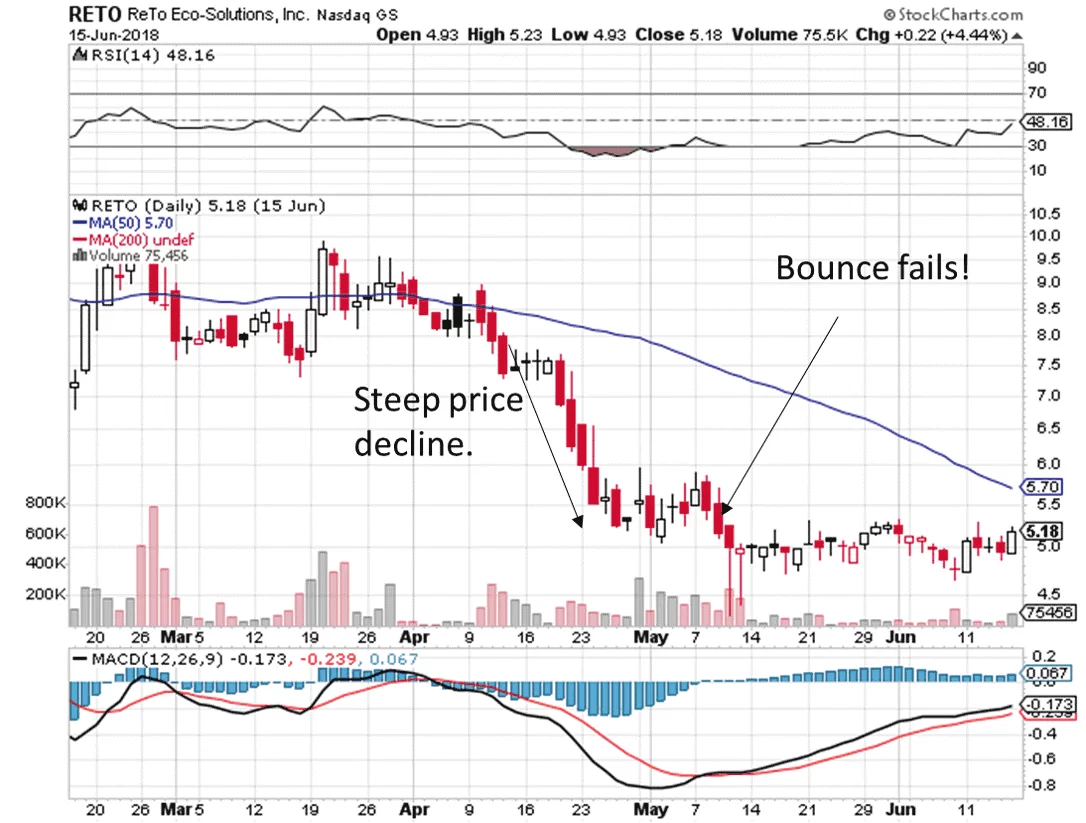
Here is an example of a trade I made where the Fish Hook pattern failed (below). You can see in the chart that the pattern formed nicely in April/May.
Unfortunately, the hook part of the pattern did not complete, and the price broke down. I sold for a small loss as the price went lower than the bottom of the fish hook.
As with all trading, the goal is to cut your losses short to preserve your capital. It can be a thin line that separates profitable from unprofitable trading.
- The Bull Flag Continuation Pattern
The Bull Flag is one of the most popular stock trading patterns. It has been called ‘the most predictable pattern’ and it is one of my favorites. None of these patterns are an exact science.
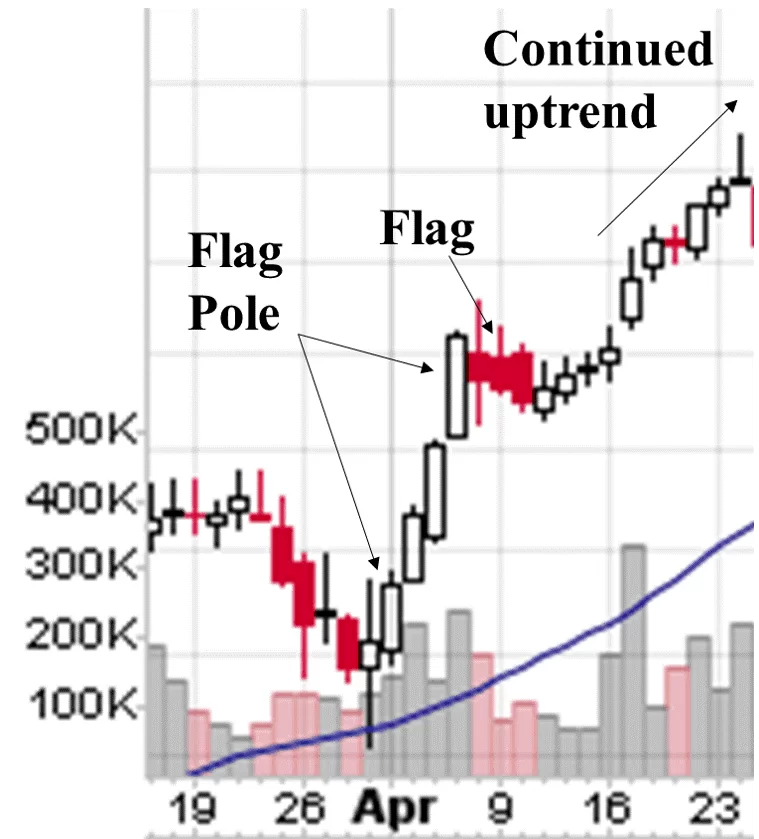
The Bull Flag pattern is quite simple. Imagine that a stock has made a big move up in price, rests for a while and then continues the upwards trend.
The big move up in price is known as the ‘flag pole’ (see the chart below). The stock will trend sideways or slightly downwards in price during the resting or ‘flag’ part of the pattern.
If the pattern works, the uptrend will continue after the period of rest. This is when you should purchase the stock!
I usually purchase the stock on the day when the first green candle forms. In the chart above, I purchased the stock at the very end of the flag phase, the day after the three red candles that make up the flag section. The timing of when to buy a Bull Flag pattern is the hardest part!
Recommended Stock Investing Posts:
- A Review of The Truth About Money by Ric Edelman
- Critical Reasons To Invest In Small Cap Stocks
- Top 10 Ways to Quickly Improve Your Trading Skills
- 2 Easy Ways to Use Arbitrage to Make Money in the Stock Market
- 6 of the Most Popular Instruments for Financial Traders
- 3 Reasons Day Traders Need To Use Volume Weighted Average Price
- Top 3 Trading Books Every Trader Should Read
- Top 3 Bollinger Bands Trading Strategies
I held this stock for about a week and made 10% profits trading it. I had a stop loss set at 5% below the bottom of the flag to ensure that I cut my loss quickly if the downtrend resting phase of the pattern continued.
How to find stocks that are starting to form a Bull Flag pattern
Finding Bull Flag patterns is quite easy. You simply set the screener in Finviz to show stocks that are overbought (RSI > 60). A search through the results will usually yield some potential Bull Flag patterns that are forming.
- The Breakout Pattern
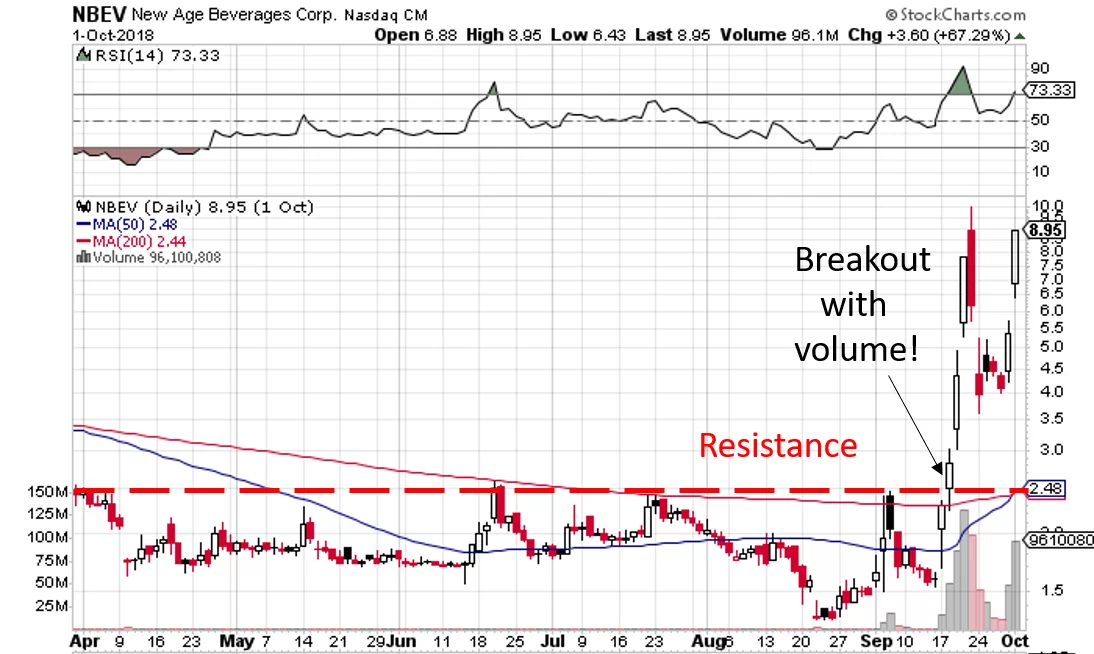
The final pattern that I want to share with you is called a Breakout. A stock is said to ‘breakout’ when there is a dramatic increase in price and volume that causes the stock price to soar to new highs. Usually, this means that the price breaks through recent resistance areas on the chart.
Often, a breakout is triggered by a catalyst like good news or a press release is released. Here is a good example of a recent breakout pattern that worked out extremely well for me (below).
This pattern starts when the price of the stock starts to increase rapidly above recent price highs. You can see in the chart that the stock price had struggled to go above about $2.48 per share for months. This line of resistance was breached around the 18th of September. The volume started to increase which is a strong indication of a breakout.
I purchased this breakout at the end of the day that it broke through the resistance line. Over the next few days the price skyrocketed almost 400% ! This is a good example of the huge potential that low float, small cap stocks have when they breakout.
How to find stocks that are breaking out
Screening for breakout stocks is pretty easy. I usually just use Finviz.com and screen for stocks that have ‘unusual volume’ and have hit a ’50 day high’ in price. These screening criteria can be adjusted a bit, but usually you will find some breakout stocks to check through.
The difficult part of trading the breakout pattern is being disciplined. You have to be prepared to sell the stock for a small loss if the pattern fails. You also have to have the patience to hold the stock after the breakout occurs to maximize your profit over a few days. This is easier said than done!
Conclusions
I hope that by sharing my trading favorite patterns with you, that you will have a good starting point to learn more about these patterns and others. Trading successfully takes practice and experience, but it can be a very lucrative and fun side business.
Many of my friends are also part-time traders. Many of them are small business owners (one of them runs a freelance bookkeeping business and another is a freelancer that does proofreading from home). The most recent guy that I have convinced to start trading has already had massive financial success starting and running an Amazon FBA business.
They all use the profits from their freelance businesses to make extra money trading stocks. It is a fun side hustle and I hope you are inspired to start!
Author Bio:


